Introduction
Modern classrooms and corporate training programs generate enormous volumes of learner data daily—login timestamps, quiz scores, time-on-task metrics, discussion participation, resource downloads, and much more. Yet 79% of institutional leaders express interest in analytics, while only 67% believe their organisations can actually use that data effectively. Without the right tools, most learner data goes to waste.
Learning analytics tools bridge this gap by transforming raw learner data into actionable insights that improve learning outcomes. They help educators identify struggling learners early, personalise instruction at scale, and make data-informed decisions rather than relying on intuition.
For K–12 teachers, these platforms flag at-risk students before they fall behind. For school administrators, they surface patterns across classrooms and inform decisions at the district level.
This guide walks through the four core types of learning analytics, profiles the top 10 tools for 2025, and explains how to choose the right platform for your context—whether you're a classroom teacher, a school leader, or managing learning programmes across an entire district.
TLDR
- Learning analytics collects and analyzes learner data to improve educational and training outcomes
- Four core types cover the full picture: descriptive (past events), diagnostic (root causes), predictive (future risks), and prescriptive (recommended actions)
- Top tools include TalentLMS, Moodle, Docebo, Watershed, and Intellischool — suited to corporate training, K-12 schools, and enterprise learning respectively
- Choose based on LMS integration, ease of use, data privacy compliance, and whether the tool supports your specific learner context (school, college, or corporate)
What Is Learning Analytics?
Learning analytics is the process of measuring, collecting, analyzing, and reporting data about learners and their contexts to optimize learning outcomes. The Society for Learning Analytics Research (SoLAR) defines it as "the collection, analysis, interpretation and communication of data about learners and their learning that provides theoretically relevant and actionable insights to enhance learning and teaching."
What data does it draw from?
- Login frequency and session duration
- Assessment results and quiz scores
- Course completion rates
- Resource usage (videos watched, PDFs opened)
- Participation in discussions or forums
- Time spent per activity or module
Why it matters for schools and trainers
Instead of guessing why students disengage or why a training module underperforms, analytics tools surface patterns early. Teachers can identify at-risk students before they fall behind. School administrators can spot systemic gaps across classrooms and adjust curriculum pacing accordingly.
The result: decision-makers move from reactive troubleshooting to proactive, evidence-based intervention.
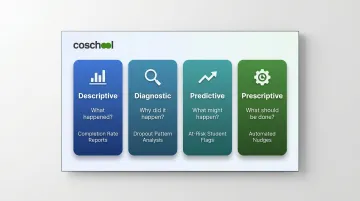
The 4 Types of Learning Analytics
Learning analytics tools fall into four categories—each answering a different question and serving a different purpose. Knowing the distinction helps you evaluate which tools your school or platform actually needs.
Descriptive Analytics: What Happened?
Descriptive analytics answers "what happened?" by summarizing past events. It includes reports on completion rates, attendance logs, average quiz scores, and participation trends. Most LMS dashboards offer descriptive analytics as a standard feature—think bar charts showing course enrollment over time or tables listing which learners finished which modules.
Use case: A department manager reviews a monthly report showing that 72% of employees completed compliance training on time, while 28% missed the deadline.
Diagnostic Analytics: Why Did It Happen?
Diagnostic analytics examines root causes to answer "why did it happen?" It identifies patterns, anomalies, and root causes. For example, diagnostic tools can reveal that a specific module has a 40% dropout rate because it's too long, poorly structured, or lacks interactive elements.
Use case: A curriculum designer discovers that students who fail a final exam consistently struggled on Module 3 quizzes, indicating a knowledge gap that needs remediation.
Predictive Analytics: What Might Happen?
Predictive analytics uses historical data and machine learning to forecast future outcomes. It flags at-risk students before they fail, anticipates knowledge gaps, and estimates future performance. Georgia State University uses predictive models tracking 800+ risk factors per student, boosting graduation rates by 7% and narrowing equity gaps.
Use case: An LMS predicts that a learner who hasn't logged in for five consecutive days has a 75% probability of dropping out, triggering an automated nudge to re-engage.
Prescriptive Analytics: What Should Be Done?
Prescriptive analytics answers "what should we do?" by recommending or automating interventions. This is the most advanced type: algorithms send reminders to inactive learners, recommend remedial modules, or route struggling students to advisors. Georgia State's chatbot automatically engages students flagged by analytics, triaging issues and connecting them to support.
Use case: A corporate LMS detects that an employee scored below 60% on a sales certification exam and automatically assigns a personalized review module before they can retake the test.
Here's a quick reference for how the four types compare:
| Type | Core Question | Example Output |
|---|---|---|
| Descriptive | What happened? | Completion rate reports, attendance logs |
| Diagnostic | Why did it happen? | Dropout pattern analysis, quiz correlation reports |
| Predictive | What might happen? | At-risk student flags, dropout probability scores |
| Prescriptive | What should be done? | Automated nudges, personalized module assignments |
Top 10 Learning Analytics Tools
We selected these tools based on analytics depth, ease of use, integration capabilities, user reviews, and suitability across K–12, higher education, and corporate training contexts. The comparison table below summarizes all ten:
| Tool | Type | Best For | Pricing Model (USD) |
|---|---|---|---|
| TalentLMS | LMS with built-in analytics | Corporate training, SMEs, onboarding | Free plan; paid from $119/month |
| Moodle | Open-source LMS + plugins | K–12, higher ed, budget-conscious institutions | Free; MoodleCloud from $170/year |
| Docebo | Enterprise LMS + BI integrations | Enterprise L&D, data-driven corporate training | Custom pricing |
| 360Learning | Collaborative LMS + BI connector | Collaborative learning at scale, L&D teams | Team plan $8/user/month; Enterprise custom |
| Absorb LMS | Cloud LMS + Absorb Analyze BI | Large enterprises, content-rich programs | Upon contact |
| SC Training | Mobile-first LMS + Power BI/Tableau | Mobile training, frontline workers, onboarding | $24/admin/month + $5/user/month |
| Learning Pool | LRS/LMS with xAPI | Enterprise onboarding, upskilling, workforce training | Upon request |
| Watershed | Dedicated LRS + analytics platform | Cross-platform enterprise analytics | Free LRS; paid plans from ~$4,083/month |
| iSpring Learn | eLearning LMS + 25+ visual reports | Employee training, skill development, compliance | From ~$3.97/user/month billed annually |
| Intellischool | K–12 analytics platform | K–12 schools, school districts | From $8/student/year; 300-student minimum |
TalentLMS
TalentLMS is a cloud-based LMS serving 12,000+ customers and 22 million learners. Built-in reporting dashboards, automated report delivery, and learner survey integration make it a practical choice for both corporate and academic training.
- Automated reports sent to stakeholders on a schedule
- Real-time learner progress tracking with no data science expertise required
- Exportable insights supporting SCORM 1.2, xAPI, and cmi5 standards
| Attribute | Details |
|---|---|
| Key Features | Automated reports, activity logs, custom scheduling |
| Best For | Internal training, SMEs, onboarding |
| Pricing | Free plan (5 users, 10 courses); Core $119/month, Grow $229/month, Pro $449/month; Enterprise custom |
Moodle
Moodle is a free, open-source LMS powering 500 million users on registered Moodle sites. Widely adopted in K–12 and higher education globally, it offers built-in analytics, a plugin ecosystem (including LearnerScript and IntelliBoard), and a Moodle Analytics API for custom integrations.
- Highly customizable via open-source plugins
- Supports heat maps, dropout-mitigation tools, and predictive models
- MoodleCloud plans provide hosted SaaS options for schools without technical teams
| Attribute | Details |
|---|---|
| Key Features | Built-in logs, open-source plugins, Moodle Analytics API |
| Best For | Schools, universities, budget-conscious institutions |
| Pricing | Free open-source; MoodleCloud from $170/year (50 users) |
Docebo
Docebo is an enterprise-grade, AI-first LMS that centralizes learning data from multiple sources. It provides real-time dashboards, seamless Salesforce and Workday integrations, and AI-powered content creation and recommendations.
- Customizable analytics dashboards with live updates
- BI tool integrations (Power BI, Tableau) connect learning data to business KPIs
- Harmony AI automates content curation and delivers personalized learning paths
| Attribute | Details |
|---|---|
| Key Features | Real-time dashboards, BI integrations, AI-powered recommendations |
| Best For | Enterprise L&D, data-driven corporate training |
| Pricing | Custom pricing (Elevate, Enterprise tiers based on active users) |
360Learning
360Learning is a collaborative LMS that empowers subject matter experts inside organizations to build and deliver courses. Automated reporting, Data Connect (a universal BI connector), and role-specific dashboards for managers and teams round out its analytics offering.
- Role-specific dashboards tailored for managers and team leads
- Data Connect exports raw learning data to BI tools
- Designed to prove learning ROI directly to business stakeholders
| Attribute | Details |
|---|---|
| Key Features | Automated and custom reports, universal BI connector, manager dashboards |
| Best For | Collaborative learning at scale, L&D teams |
| Pricing | Team plan $8/user/month (up to 100 users); Business and Enterprise custom |
Absorb LMS
Absorb LMS is a cloud-based, AI-powered LMS offering customizable reporting with pre-built templates and the Absorb Analyze BI tool. It excels at identifying skill gaps and linking training to performance outcomes in large organizations.
- Configurable and shareable reports
- Search Analytics Report for learning data management
- Connects training completion to business performance metrics
| Attribute | Details |
|---|---|
| Key Features | Custom reports, Absorb Analyze BI tool, pre-built templates |
| Best For | Large enterprises, content-rich programs |
| Pricing | Upon contact |
SC Training (formerly EdApp)
SC Training is a mobile-first LMS focused on microlearning. A built-in reporting suite with Power BI and Tableau integrations, course/lesson/slide-level drill-downs, and real-time insights make it well-suited for frontline workers and on-the-go training.
- Course, lesson, slide, and user-level drill-downs
- Gamification features contribute to engagement data
- Strong automation for quizzes and content creation
| Attribute | Details |
|---|---|
| Key Features | Power BI/Tableau integration, course-level drill-downs, real-time reporting |
| Best For | Mobile training, frontline workers, onboarding |
| Pricing | Free plan (10 learners); Premium $5/user/month + $24/admin/month; Enterprise custom |
Learning Pool
Learning Pool is a full-service training platform with a standalone Learning Record Store (LRS) that aggregates xAPI data. Built on the open-source Learning Locker project, it offers AI-powered reporting for predictive insights, engagement tracking, and BI tool integrations.
- Functions as both an LMS and a standalone LRS
- xAPI support enables cross-platform data aggregation
- AI-powered reporting delivers predictive insights
| Attribute | Details |
|---|---|
| Key Features | xAPI/LRS, AI-powered reporting, engagement tracking |
| Best For | Enterprise onboarding, upskilling, workforce training |
| Pricing | Upon request |
Watershed
Watershed is a dedicated learning analytics platform and LRS built on xAPI. Designed for organizations with complex, multi-platform learning ecosystems, it offers diverse report types (pie charts, heat maps, spider charts), customizable dashboards with HTML/video embeds, and CSV-to-xAPI conversion.
- Diverse report types (heat maps, spider charts, pie charts)
- Customizable dashboards with HTML/video widgets
- Connects learning data to business KPIs across platforms
| Attribute | Details |
|---|---|
| Key Features | xAPI LRS, custom report builder, personalized dashboards |
| Best For | Enterprises needing cross-platform analytics |
| Pricing | Free LRS available; paid plans scale by learner population |
iSpring Learn
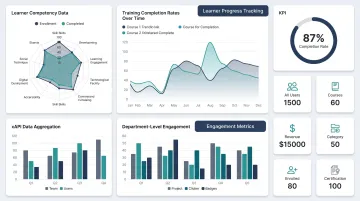
iSpring Learn is a global eLearning platform offering 25+ customizable visual reports, a supervisor dashboard for real-time team insights, and competency radar charts for holistic performance tracking at team, department, and individual levels.
- Visual competency radar charts
- Team/department/individual-level tracking
- Strong certification management
| Attribute | Details |
|---|---|
| Key Features | 25+ visual reports, supervisor dashboard, competency tracking |
| Best For | Employee training, skill development, compliance |
| Pricing | From ~$3.97/user/month billed annually |
Intellischool
Intellischool is a purpose-built learning analytics platform for K–12 schools. Data visualization, learner/class/curriculum profiling, task adherence analysis, and alerts for attendance and academic underperformance are all built in. It integrates with Canvas, Schoolbox, and other school systems.
- Embeddable data visualizations for classroom use
- Alert system for attendance and underperformance
- Task adherence analysis for data-driven teaching
| Attribute | Details |
|---|---|
| Key Features | Learner/class/curriculum profiles, attendance alerts, task adherence analysis |
| Best For | K–12 schools, school districts |
| Pricing | $8/student/year (Essentials); Plus $15, Ultimate $20; 300-student minimum |
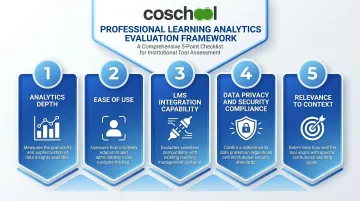
How We Chose the Best Learning Analytics Tools
We evaluated tools across five criteria:
- Analytics depth — support for descriptive, diagnostic, predictive, and prescriptive analytics; variety of dashboards and reports
- Ease of use — accessible to non-technical educators and trainers without data science expertise
- LMS integration capability — compatibility with existing systems (Google Classroom, Canvas, HRIS platforms) and BI tools (Power BI, Tableau)
- Data privacy and security compliance — adherence to India's Digital Personal Data Protection Act (DPDPA) 2023, along with FERPA (US) and GDPR (EU) for internationally aligned tools
- Relevance to context — suitability for K–12, higher education, or corporate training
Common buyer mistake: Choosing a tool based on brand recognition alone without checking whether it fits your learner context or integrates with your existing systems.
Your context shapes what matters most in a tool. For K–12 schools specifically, focus on:
- Early intervention alerts and teacher-friendly dashboards
- Student data privacy compliance (DPDPA 2023 for India; FERPA for US-aligned platforms)
- Integration with existing school management or LMS systems
To stress-test your shortlist, the Forrester Wave for Learning Management Systems and Experience Platforms (Q1 2024) evaluated 29 criteria across vendor ecosystems. Independent research like this helps you move beyond vendor marketing when making your final call.
Conclusion
The best learning analytics tool isn't the most feature-rich—it's the one that fits your learners, integrates with your systems, and surfaces the right insights for the people who act on them.
For K–12 schools looking to embed analytics into everyday teaching, **Coschool's AI-driven adaptive learning** surfaces real-time performance insights for teachers without requiring a dedicated analytics team. It flags knowledge gaps as they emerge and helps teachers personalise learning at the individual student level.
Schools using Coschool's SchoolAI platform have achieved 8–12% increases in class averages by combining AI-led personalised support with performance data delivered directly to teachers.
Start with your core question: "Do I need to close learning gaps across classrooms?" "Do I need to identify at-risk students early?" "Do I need to prove training ROI?" "Do I need to track compliance completion?" Choose a tool that answers it directly. For K–12 schools, Coschool is built around exactly that principle—connecting real-time student data to the teachers who can act on it.
Frequently Asked Questions
What are learning analytics tools?
Learning analytics tools are software platforms that collect, analyse, and visualise data from learning activities—logins, assessments, completion rates, engagement metrics—to help educators and trainers make data-informed decisions that improve instruction and learner outcomes.
What are the 4 types of learning analytics?
The four types each serve a different purpose:
- Descriptive — what happened, such as completion rates or login frequency
- Diagnostic — why it happened, such as identifying why a module has high dropout
- Predictive — what might happen, such as flagging at-risk students before they disengage
- Prescriptive — what to do, such as automated nudges or recommended learning modules
What are the best learning analytics tools?
For schools: Intellischool and Moodle. For corporate training: TalentLMS and Docebo. For dedicated cross-platform analytics: Watershed. Choice depends on your context, budget, and integration needs.
How do learning analytics tools help teachers?
Analytics tools help teachers:
- Identify at-risk students early before performance drops
- Track engagement and progress in real time
- Personalise instruction based on individual performance data
- Reduce reliance on guesswork when making instructional decisions
What should I look for when choosing a learning analytics tool?
Prioritise integration with your existing LMS or SIS, ease of use for non-technical staff, support for early intervention alerts, data privacy compliance (FERPA, GDPR), and alignment with your specific use case (K–12, higher ed, or corporate).
Can learning analytics improve student outcomes?
Yes. Georgia State University used predictive analytics to boost graduation rates by 7% and narrow equity gaps. Organisations using prescriptive analytics automate timely learner support, driving measurable improvements in completion rates and performance.